Posts

Showing posts from 2015

VMware vROps - Oversized VMs Dashboard

Image
Oversized VMs in a virtualized environment lead to wasted resources and lower consolidation ratios. This also introduces performance problems such as CPU Contention and Ready as the workload utilization increases. The Oversized VMs Dashboard will help you find and analyze VM candidates that could be down-sized and enable your organization to get more with less. The goal of this dashboard is to empower virtualization admins to find over-sized VMs, analyze their historical resource utilization, provide sizing recommendations, and back it up with evidence in order to reclaim unused resources. I know what you're going to say: "easier said than done." Yes, the battle to reclaim resources is mostly a lost one already unless you can educate your users upfront and prevent over-sizing to begin with. If you still want to endeavor on that journey, then I highly recommend you read a VMware White Paper entitled VM Right-Sizing Best Practices Guide by VMware's  Jason Garudre

VMware vROps - Application VMs Performance Dashboard

Image
The Application VMs Performance Dashboard is an example that could be used to empower application owners/analysts to monitor their own VMs and the infrastructure hosting them.  Your initial instinct maybe "why would I ever let those people see my environment!?!" Stop and think about it for a minute. You could get "those people" off your back and focus on more important things. Being transparent and offering a bit of education will go a long way in gaining trust and respect.  More importantly, this is a great  way of preventing finger-pointing among infrastructure and application teams during escalations. By providing environment visibility this dashboard shifts the conversation from "virtualization sucks" to solving the real issues causing poor application performance or other problems virtualization gets blamed for.

VMware vROps - vSphere Cluster Capacity and Performance Dashboard Part 2 - Top Offenders

Image
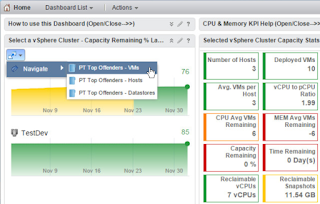
As promised in part 1 of the  VMware vROps - vSphere Cluster Capacity and Performance Dashboard post, here is part 2. In this post, I'll cover a set of three Top Offenders dashboards that allow you to find the objects (VMs, Hosts, Datastores) behind some of the values, like Highest VM CPU Ready %, in your cluster. As discussed in the last post, this is accomplished via the Dashboard Navigation feature introduced in vROps. In essence, this functionality combined with the three Top Offenders dashboards supplants the drill-in limitation of the Scoreboard widget and Super Metrics I mentioned in the previous post.

VMware vROps - vSphere Cluster Capacity and Performance Dashboard Part 1

Image
The vSphere Cluster Capacity and Performance custom dashboard provides a great overview of the cluster's capacity stats based on currently set policy as well as a sanity-check in the form of performance KPIs. The idea behind this dashboard is to empower the user to achieve the desired consolidation ratio while keeping the VM owners happy by avoiding performance bottlenecks and maintaining the agreed upon SLA. This dashboard is intended for cloud-virtualization infrastructure team managers/leads and/or a capacity planning team in an enterprise. One thing you will notice about this dashboard is that it crosses from capacity to performance. I strongly believe that you cannot manage one without considering the other, as they go hand-in-hand. This also addresses the one weakness of the out-of-the-box (OOTB) dashboards, in that they focus on a single resource and object type at a time. For example, CPU and Host. This single-dimensional focus is a limiting factor in presenting a com

VMware vROps - EPOps vCenter Monitoring Dashboard

Image
The release of VMware vRealize Operations Manager (vROps) 6.1 opens up the door for new possibilities in custom dashboard design using the End-Point Operations (EPOps) Agent data. As a proof of concept, I recently designed a simple dashboard for one of my customers that leverages the new capabilities, which enable monitoring in-guest services as well as a collection of OS and application metrics. This dashboard could be used by the operations team to monitor a vCenter and provide early warning on potential issues, empowering them to transition from reactive to proactive support mode. Moreover, this dashboard could be easily modified to monitor just about any  supported   OS and application running in a VM or even physical machine.  This could include monitoring of SQL, Exchange or SharePoint servers.  The possibilities are almost endless.