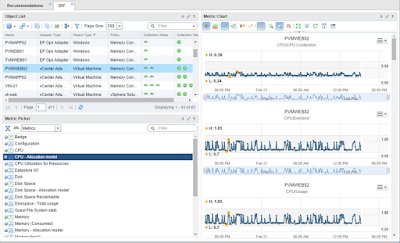
VMware vROps - Oversized VMs Dashboard
I know what you're going to say: "easier said than done." Yes, the battle to reclaim resources is mostly a lost one already unless you can educate your users upfront and prevent over-sizing to begin with. If you still want to endeavor on that journey, then I highly recommend you read a VMware White Paper entitled VM Right-Sizing Best Practices Guide by VMware's Jason Garudreau. In it you will not only find very sound logic for right-sizing but also sample emails, and when combined with the evidence from this dashboard, you should be well armed and prepared to go to battle against your VM freeloaders. If nothing else, at least you will have a bad ass dashboard you can lament over how bad things really are.
Alright, let's go over the dashboard features and functionality.
This dashboard starts with a Heatmap widget (1) in the upper left corner. It only displays VMs with low CPU demand and four or more vCPUs based on a Custom Group. This way we can focus only on larger idle VMs that will yield highest gains from our resource recovery efforts. The darker the VM color, the more idle it is. Selecting one of the VMs in the heatmap will update the remaining widgets on the dashboard with relevant information.
Below the heatmap is a Stress widget (2) that displays overall VM stress for the past seven days, hour-by-hour. This widget will show any stress, not just CPU, so it's good to have it there in case the VM is bound by other resources like memory.
In the top center column we have a View widget (3) showing us a seven-day Trendline View with selected VM's CPU Contention, Demand, Usage, and Stress percent. This way we can get a good feel of how busy this VM was in the past. You can always jump back to 30 days or however long is your vROps data retention policy using the Time Range control in the widget toolbar. This enables you to spot patterns in cyclical nature of some applications tied to some calendar events, such as month-end processing, etc.
Below the Trendline View is a Sparkline widget (4) showing each allocated virtual core Used time in milliseconds for the selected VM. This enables you to see if the application running in this VM is multithreaded based on the discrepancies in the metric values among the cores. The wider the gap, the higher the likelihood that the application is not multithreaded. Obviously, more analysis is needed and that's where the new EPOps agent can close the gap.
Moving on to the right column, on the top is a Scoreboard widget (5) configured to show the vROps sizing recommendations for the selected VM. If the Recommended vCPUs says 0 that means the VM could probably be decommissioned because vROps considers it Idle. By default, vROps considers any VMs which consistently use less that 100 MHz (adjustable via policy) of CPU power Idle and they should be decommissioned as they have probably been abandoned and no one bothered to put in a kill order.
Lastly, the Sparkline widget (6) below recommendations has all the important KPIs for the selected VM to complete the picture, including: CPU, memory, storage and network.
Armed with the historical evidence, you can use this data to prove your point while working with your application analysts/owners to improve overall performance and consolidation ratios.
For more information about vROps, see the following resources:
Books:
VMware vRealize Operations Managers Essentials by Matthew Steiner
Mastering vRealize Operations Manager by Scott NorrisVMware vRealize Operations Manager Capacity and Performance Management by Iwan 'e1' Rahabok
Official VMware:
VMware Professional Services
Official vROps Documentation
VMware Operations Management White Papers
Extensibility and Management Packs
vROps product page
Blogs:
vXpress by @Sunny_Dua
virtual red dot by @e1_ang
Virtualise Me by @auScottNorris
Elastic Sky Labs by @JAGaudreau
i'm all vIRTUAL by @LiorKamrat


Comments
Post a Comment